
Students Who Feel Safe and Capable Learn More. DC Measures Both.
School is back in full swing across the District, and these first weeks do more than set routines. Students' beliefs about school, about themselves, and about their place among their peers take shape in the first days of a new year, and the culture, climate, and sense of belonging a school builds right now feed directly into its goals for accelerating student learning. Educators know this from experience. This year, we can also put numbers to it.
Every spring, DCPS and DC public charter schools ask students a set of disarmingly simple questions on the DC SAYS survey in grades 3-12. How sure are you that you can do the hardest schoolwork that is given to you? If you fail at something important, how likely are you to try again? How often do you worry about violence at your school? EK12 paired the answers of nearly 15,000 students across our partner network with their academic and attendance outcomes.
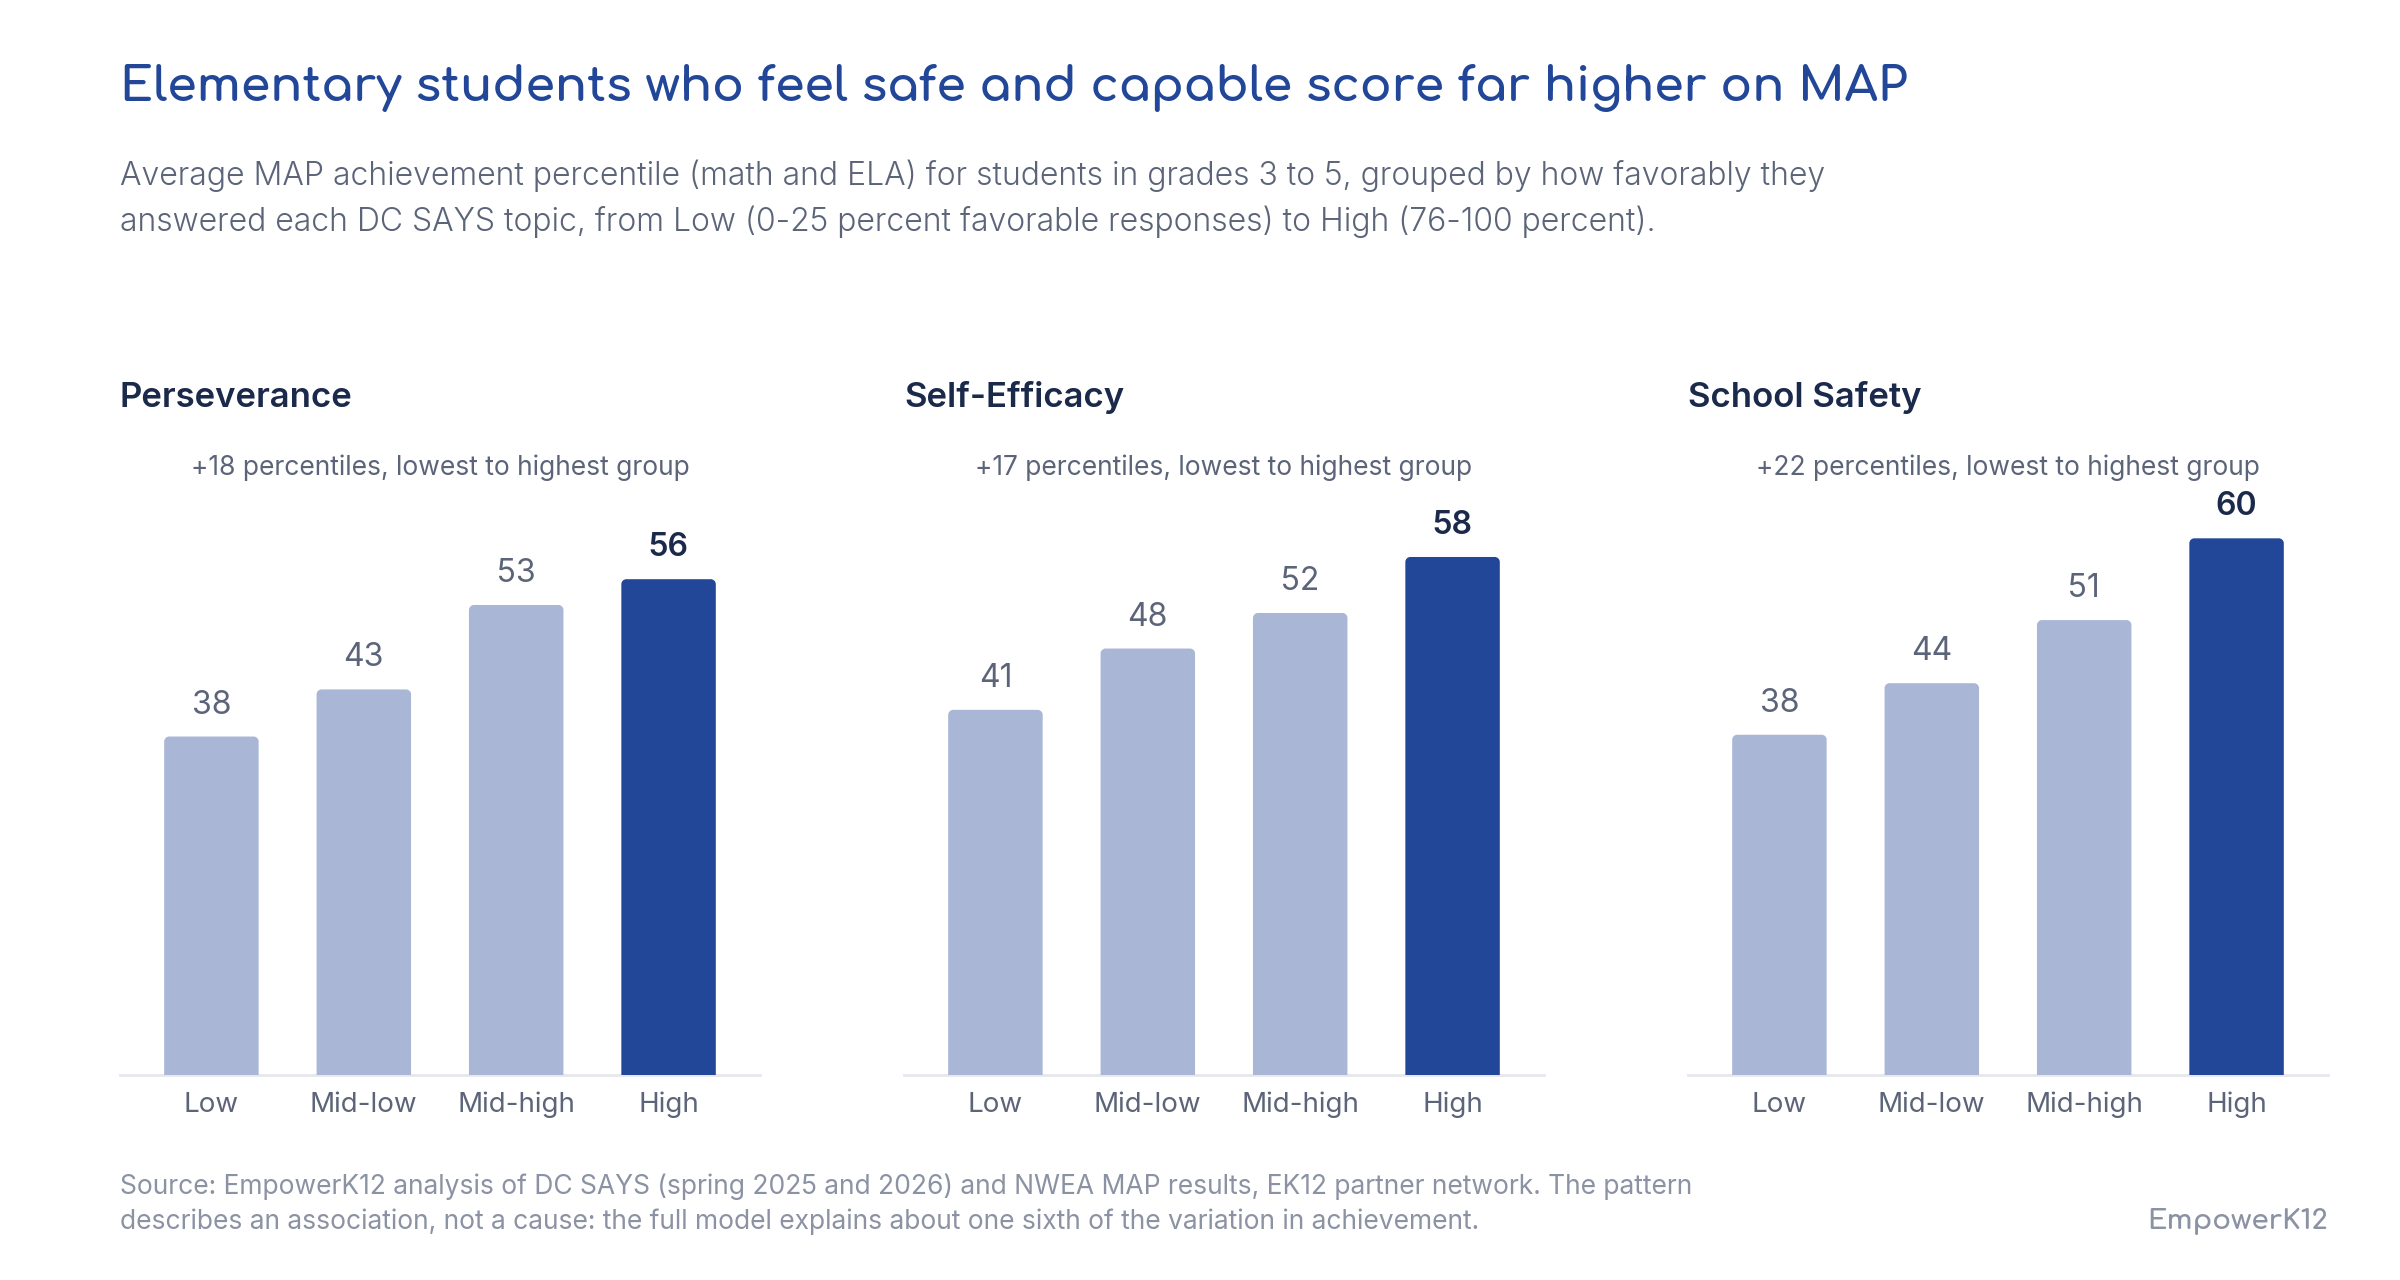
Elementary students who felt safest at school scored 17 percentiles higher on MAP than classmates who felt least safe. Students with the strongest belief in their own ability attended two to three more days of school on average. Secondary students who said they push through hard work were about a third less likely to end the year chronically absent.
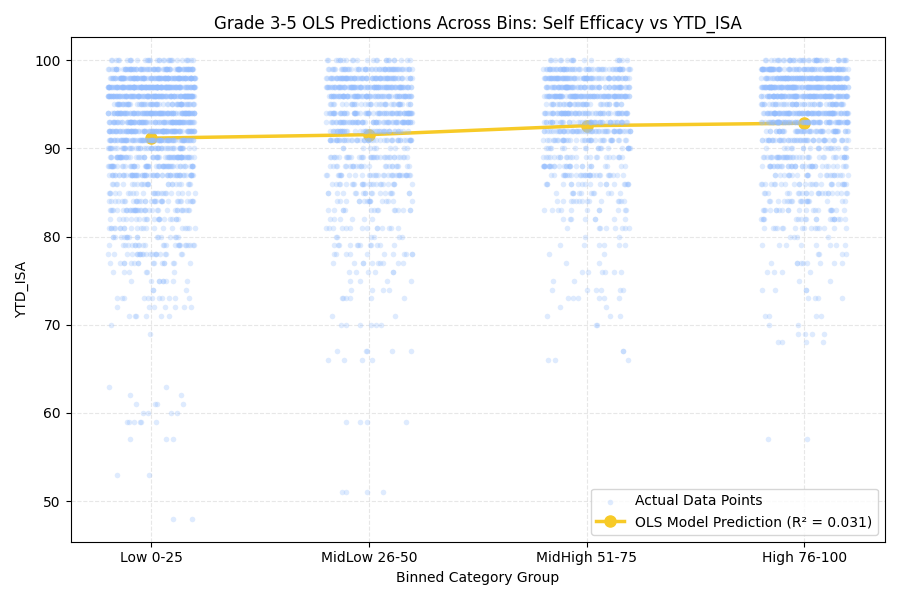
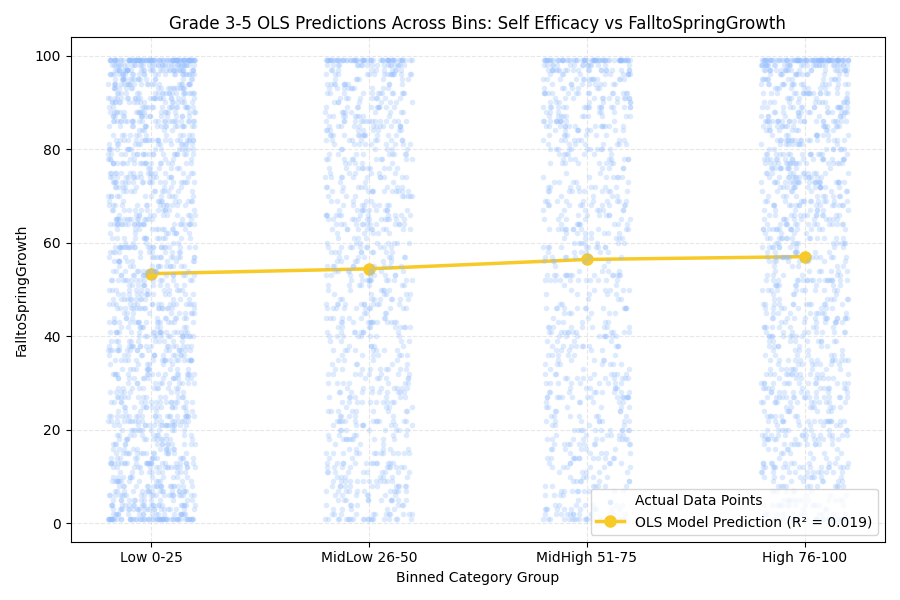
The association of student survey results with outcomes is modest and statistically significant (all results shared in this post are, p<0.05). Across topics, our models explain about a sixth of the variation in achievement, and 2-5% of the variation in attendance and growth. The directionality of every correlation follows what educators expect: the more favorable that students respond to the SAYS survey, the higher their achievement, growth, and attendance. For schools setting expectations in these first weeks of the year, students’ sense of self-efficacy, safety in class, and belonging at school are early indicators that arrive before any test score.
In this blog post, we analyze the spring 2025 and 2026 survey results of students at DC Data Hub partners at the Optimize and Transform levels alongside NWEA MAP achievement and growth, in-seat attendance, and chronic absenteeism. In-depth analytical details sit in the methods note at the end of this post.
What the 2026 SAYS survey told us
Three survey topic areas and three critical questions carried the strongest and most consistent signal.
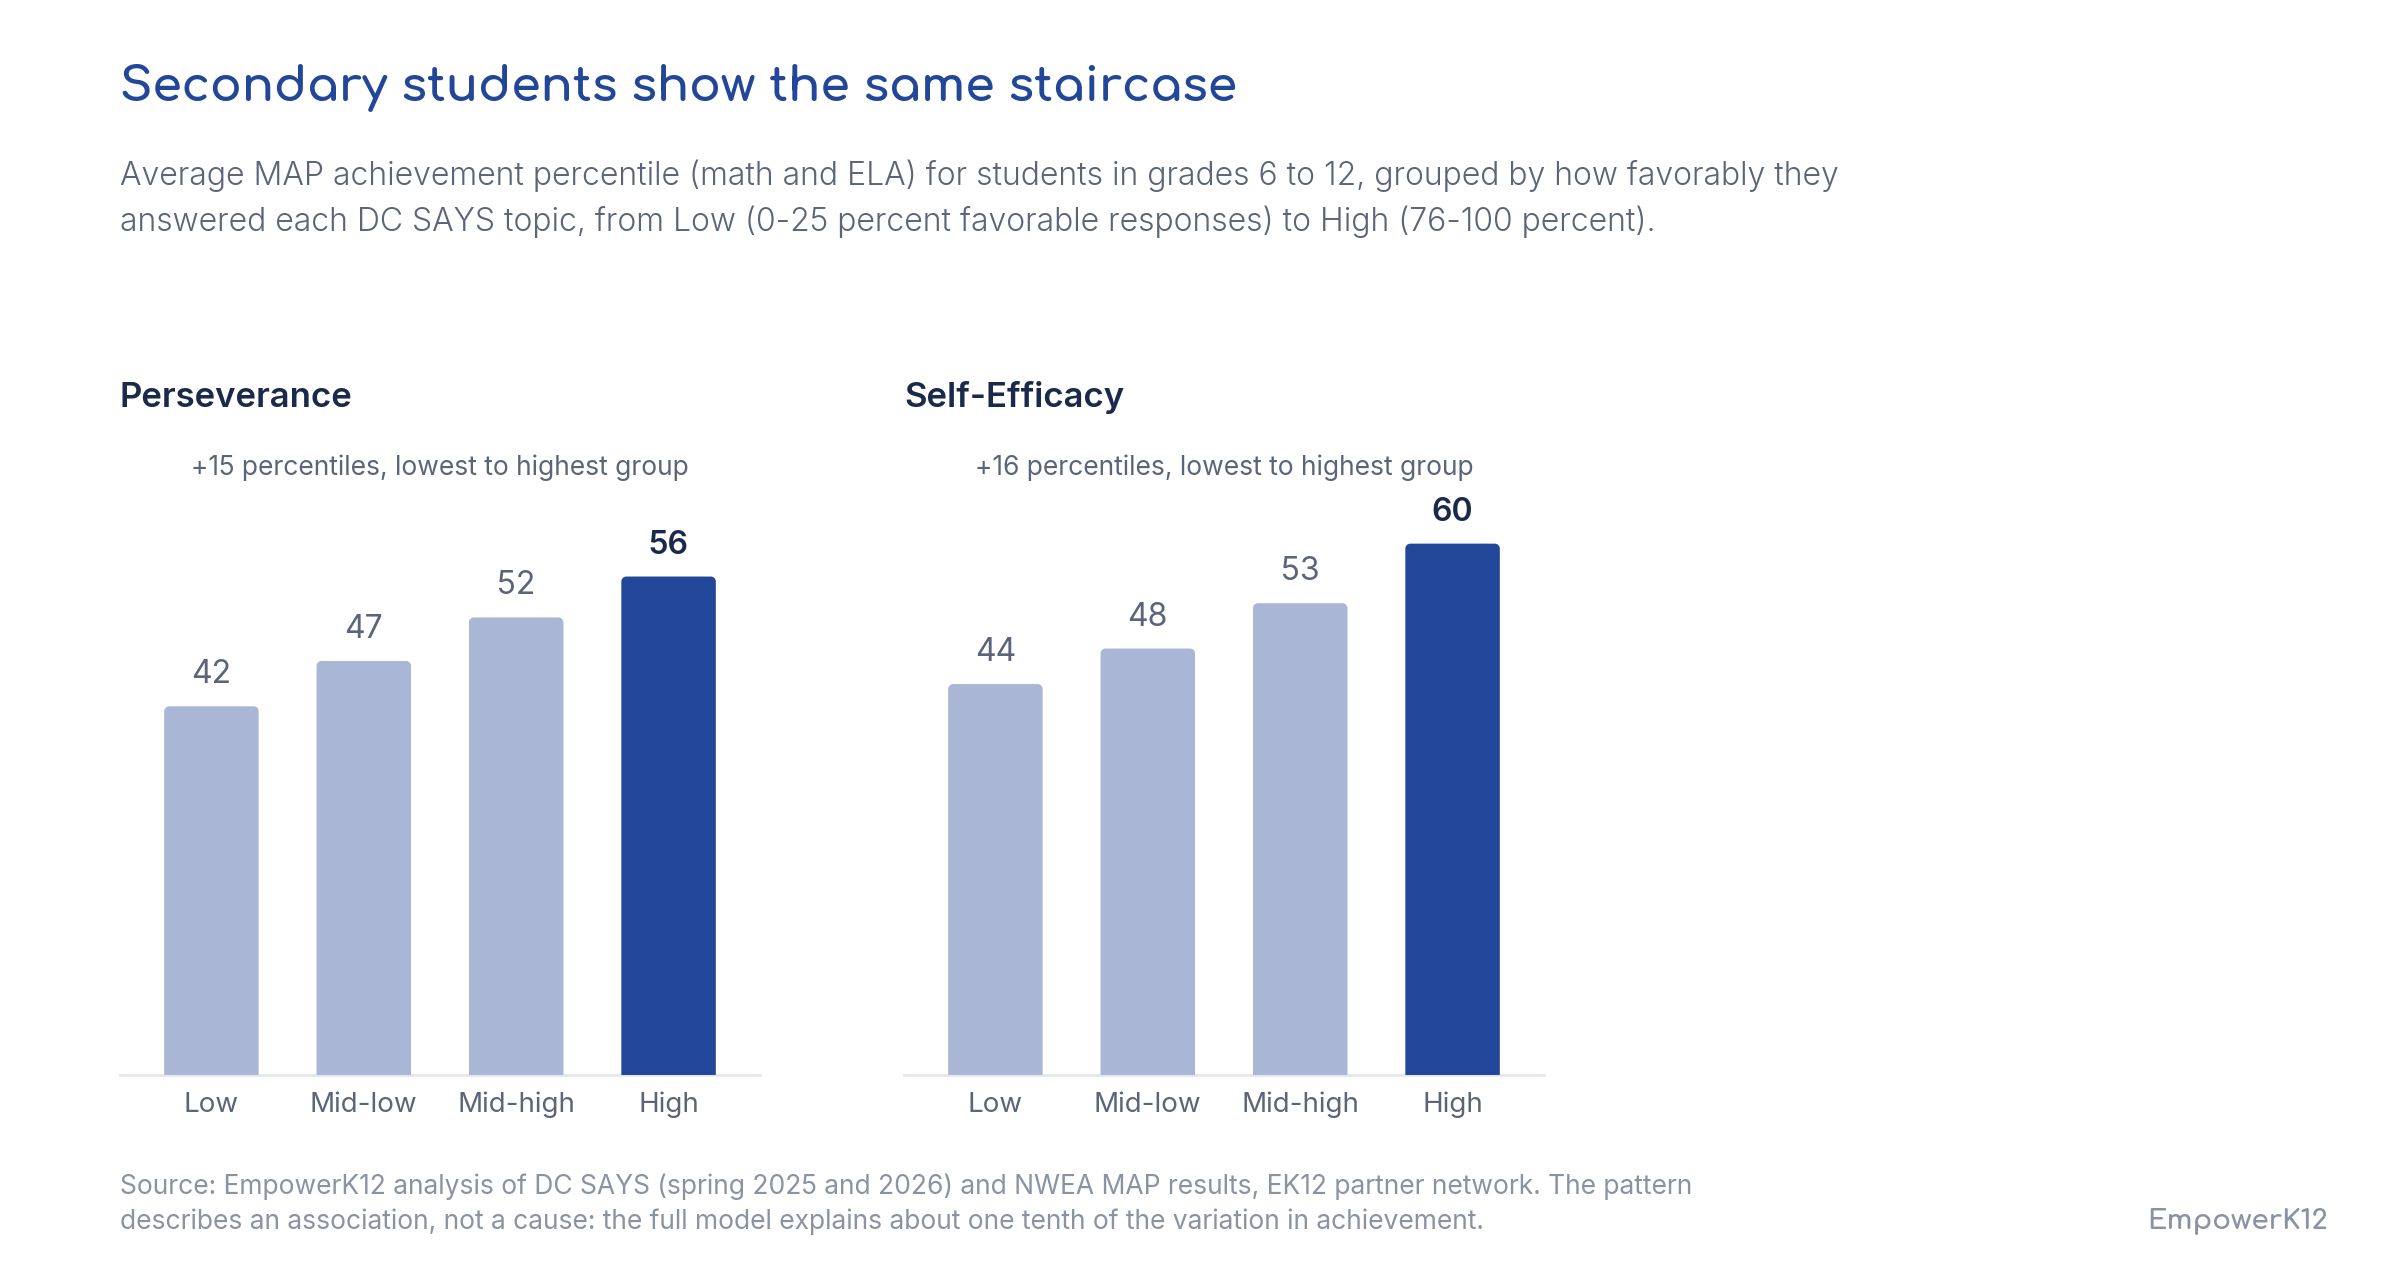
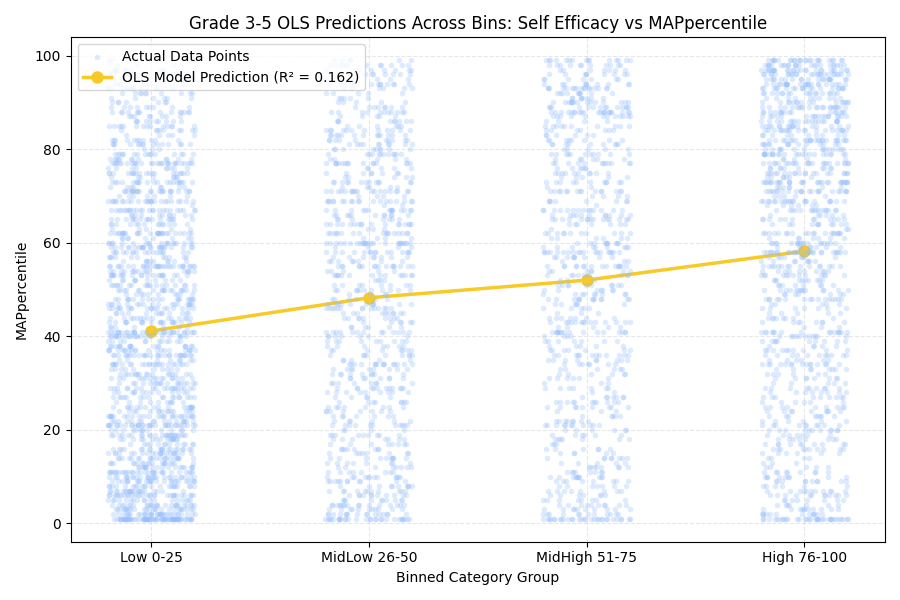
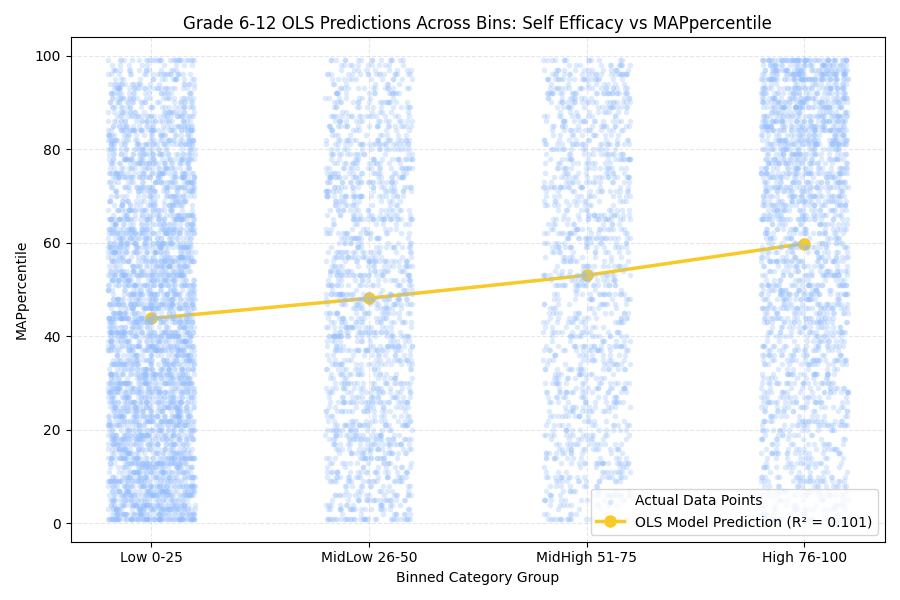
Self-efficacy is strongly linked with achievement. Students who expressed the most confidence in their own ability scored 10 percentile points higher on MAP math and reading combined in elementary school, and 13 percentile points higher in secondary school, than students who expressed the least.
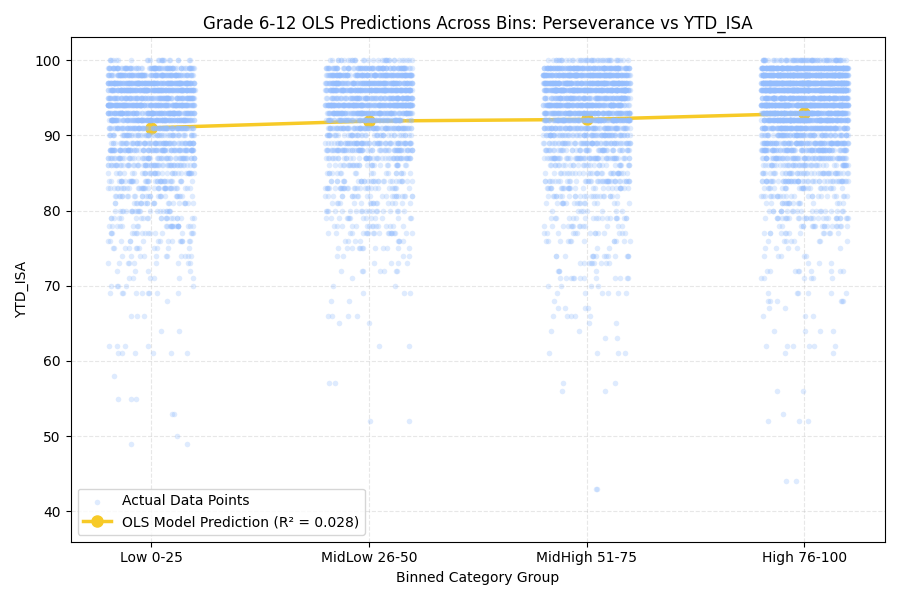
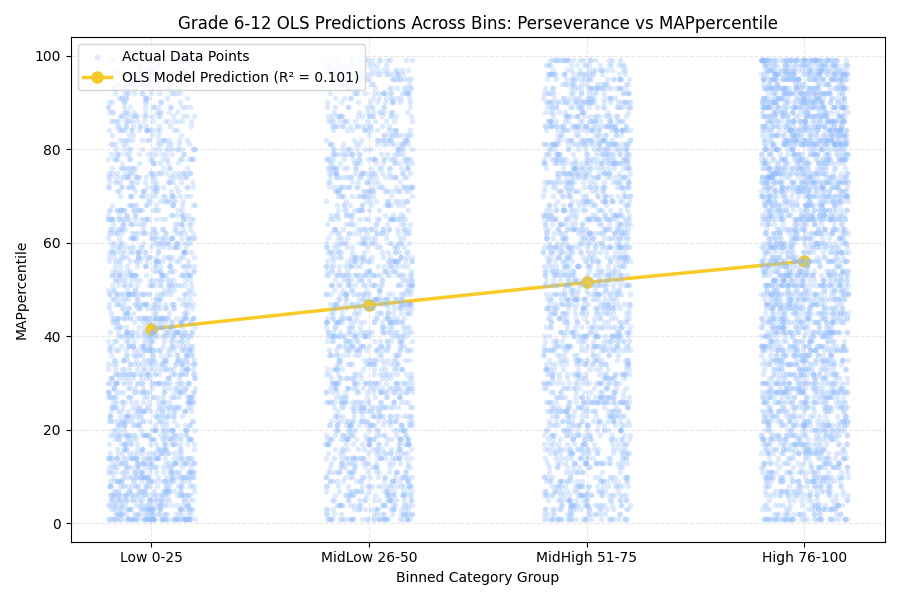
Perseverance shows up everywhere we looked. Students who said they try hard and keep going scored 7 to 10 percentile points higher, grew more within the year, attended more regularly, and were 31 percent less likely to be chronically absent.
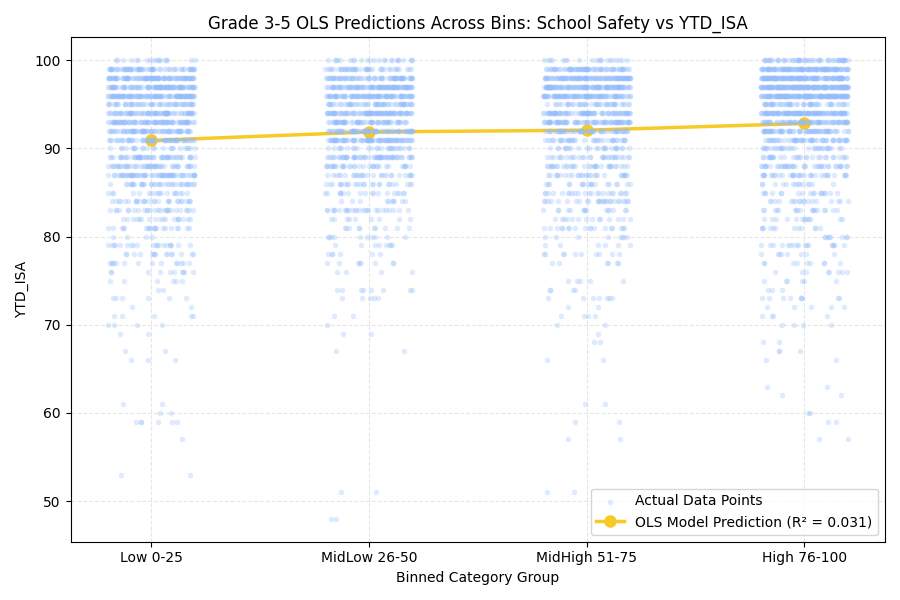
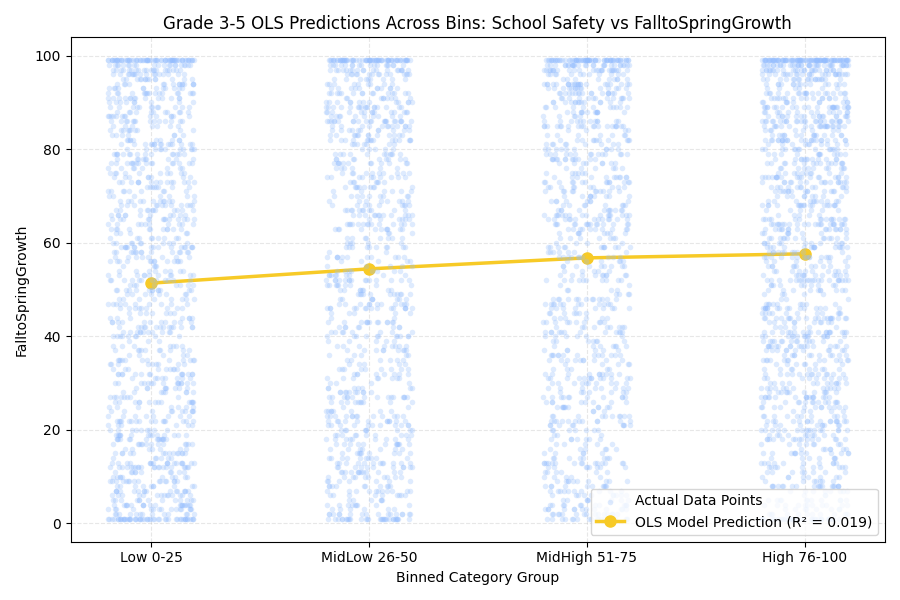
For upper elementary students, school safety is associated with stronger outcomes. Students in grades 3-5 who gave School Safety the most favorable ratings scored 17 percentile points higher than those who gave the least favorable ratings, the largest gap of any topic. They also grew more and attended about three more days of school.
Three survey questions deserve a closer look by educators. Beyond the overall survey topic areas, three questions stood out for their strong association with outcomes: whether students have a teacher or adult at school they can count on, how important students believe daily attendance is, and how often students can control their emotions when they need to.
Students who believe they can, do
The survey asks five Self-Efficacy questions, including one that could double as a mission statement for the first month of school: "How sure are you that you can do the hardest schoolwork that is given to you?"
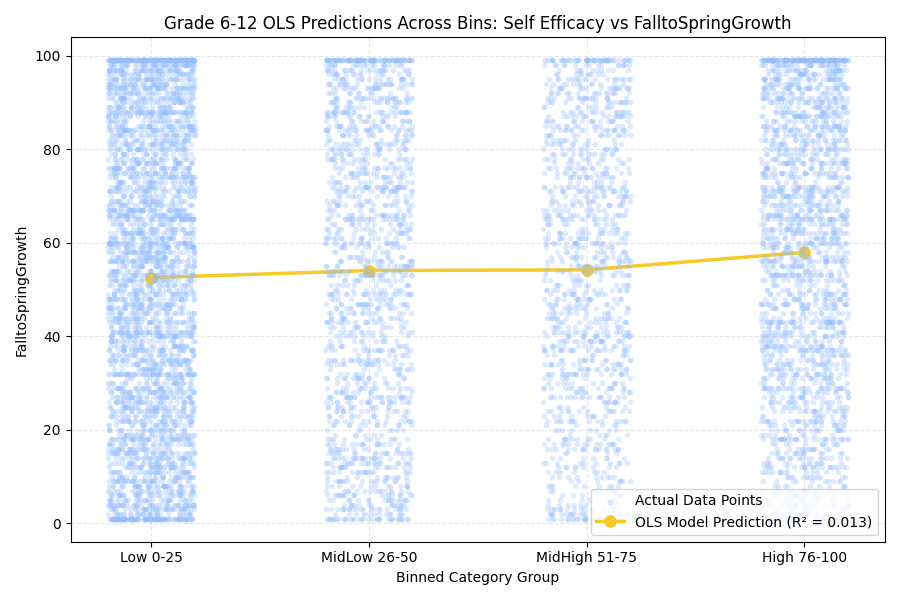
The answers predict spring achievement as well as anything on the survey. Elementary students in the most favorable response group posted MAP percentiles 10 points above the least favorable group; for secondary students the gap reached 13 points. In addition to the association with achievement, secondary students in the most favorable group also grew 4 percentile points more within the year.
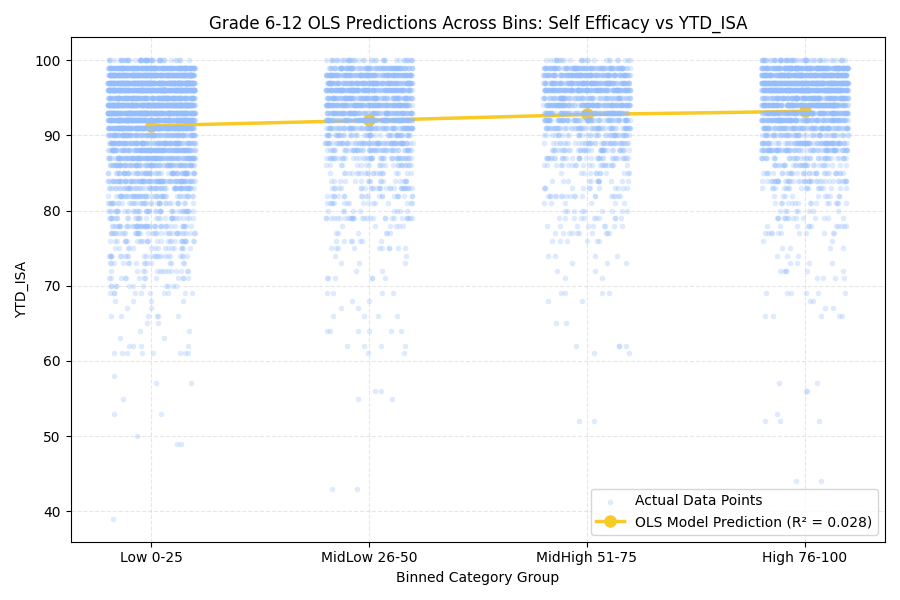
Attendance follows a similar pattern. Elementary students in the most favorable group attended at rates 1.1 percentage points higher, and secondary students 1.4 points higher, than the least favorable group (both results were statistically significant). Secondary students in the most favorable group on self-efficacy were 32 percent less likely to end the year chronically absent.
At the question level, the two items about hard schoolwork carry the signal. Students who expressed self-assurance they could handle the hardest work scored 4 to 5 percentile points higher on MAP in both grade bands, and students who felt sure they could learn every subject scored 5 percentiles higher. Confidence about completing all assigned schoolwork lined up with about one additional attendance point in both bands.
Self-efficacy sits at the core of student motivation, persistence, and the ability to work through adversity. Educators rightly spend energy on how welcome and connected students feel when they enter the building, and these findings suggest a student's sense of accomplishment deserves equal billing. Studies show that scholars identifying themselves with high self-efficacy try harder on assignments and have lower anxiety around tests and performance in school, and both technology-rich project work and steady family communication can raise the bar students set for themselves.
The power of learning to finish the work no matter what
SAYS’ perseverance questions center on goals, focus, and failure, and this humbling one proved the most correlated with student outcomes: "How often do you get your work done, even when you don't feel like doing it?"
At the topic level, elementary students in the most favorable response group scored 10 percentile points higher on MAP, and secondary students 7 percentile points higher, than the least favorable group. Elementary students in the most favorable group also grew 4 percentile points more within the year, and secondary students attended at rates a percentage point higher. Also, elementary students in the most favorable group were 31 percent less likely to end the year chronically absent.
Nearly every Perseverance question showed a meaningful association with achievement. Getting work done without feeling like it lined up with 5.8 extra percentiles for elementary students and 4 for secondary students, the strongest single question in the topic. It also lined up with 2.5 extra growth percentile points in both bands and was associated with an additional two days attending school for secondary students.

One question read us back something more complicated. Students who answered favorably about keeping after their goals when problems come up scored slightly lower, about one percentile, in both grade bands. One possibility is that students interpret the question differently than the survey intends, as we flag it as a puzzle worth a follow-up rather than a finding to act on.
Perseverance is foundational to a growth mindset, turning mistakes into learning opportunities and building learners who outlast any single classroom. The strength of the work-completion question with fall-to-spring growth suggests real gains wait inside students' personal motivation around the work, and is something EK12 intends to monitor as AI becomes more prevalent in students’ lives outside of school. Teachers can feed that motivation by praising effort and growth explicitly and by building regular opportunities for productive struggle.
So now what?
Perseverance, self-efficacy, and a felt sense of safety and belonging are supported by robust brain science research and have strong association with higher achievement, steadier growth, more days in class, and far less chronic absence. Schools that set high expectations and build belonging now, while students feel hopeful about fresh starts, develop mindsets that spring data says matter.
The social and emotional side of learning also protects students against the isolation, anxiety, and fear of failure that build over a year. Educators can take simple steps forward to track their students' SEL data, look at it alongside attendance and achievement, and treat a dip in either as a signal to act on the other. The 2026-27 optional fall SAYS survey window opens in November, and we encourage schools participate by signing up before the September 25 deadline. The habits that shape strong spring academic growth began a couple of weeks ago.
Appendix: how we did this analysis
We analyzed spring 2025 and 2026 DC SAYS results for students in grades 3 through 12 across the EmpowerK12 partner network, paired with four outcomes for the same students: NWEA MAP spring achievement percentiles (math and ELA), MAP fall-to-spring within-year growth percentiles, end-of-year in-seat attendance (ISA) rates, and end-of-year chronic absenteeism flags.
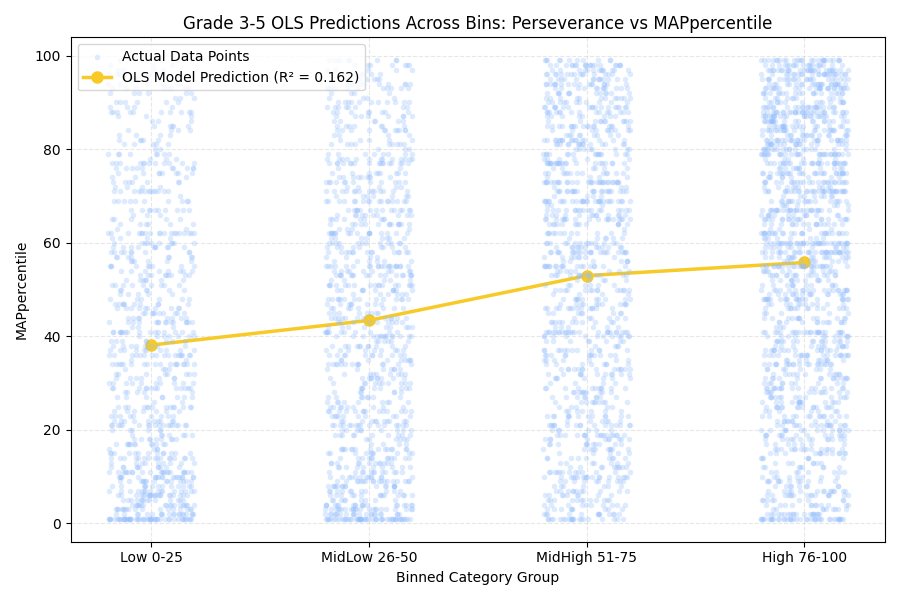
We modeled the data two ways using ordinary least squares (OLS) regression models. At the topic level, we grouped each student by their share of favorable responses on a topic: Low (0 to 25 percent favorable), Mid-Low (26 to 50), Mid-High (51 to 75), and High (76 to 100), and compared each group with the Low baseline. At the question level, we compare students answering favorably with those who did not. Topic-level models utilize 4,680 elementary and 9,114 secondary student responses. Since chronic absenteeism is a yes or no flag, we model it as odds and report the change in likelihood.
Strip plots of our OLS regression analyses can be found below:




Appendix: SAYS survey questions by topic
Self-Efficacy (favorable responses: "Very sure" and "Extremely sure")
How sure are you that you can complete all the schoolwork that is given to you?
How sure are you that you can do the hardest schoolwork that is given to you?
How sure are you that you can learn all the subjects taught in your classes?
How sure are you that you will remember what you learned in your current classes, next year?
When complicated ideas are discussed in class, how sure are you that you can understand them?
Perseverance (favorable responses: the two most positive choices, such as "Very hard" and "Extremely hard")
How hard do you work to keep your promises, even if they are hard to keep?
How often do you get your work done, even when you don't feel like doing it?
How well can you keep working to reach your goals if problems come up?
If you fail at something that is important to you, how likely are you to try again?
When you are working on something that matters to you and there are distractions, how focused can you stay?
School Safety (favorable responses: the two least frequent or least likely choices, such as "Almost never" and "Once in a while"; our analysis uses the questions identical across both survey versions and years, and the secondary version adds a question about unfair treatment by adults)
How often are people disrespectful to others at your school?
How often do students get into physical fights at your school?
How likely is it that someone from your school will bully you online?
How often do you worry about violence at your school?
If a student is bullied in school, how difficult is it for them to get help from an adult?
Appendix: other relevant reading
Black Student Belonging in K12 Schools: Implications for Policy and Practice Amid DEI Shifts
Student Differences in a SEL Program: Engagement and Individual Factors
Disentangling the Effects of SEL Programs on Student Academic Achievement Across Grades 1-12